The Startup Making It Easier for Young People to Put Money on Sports
A crop of new companies are capitalizing on the demand, offering a sports-betting-like experience that falls outside of gambling laws. The tactic has drawn throngs of new users, including young adults and people who live in states where sports betting isn’t legal.
Atlanta-based PrizePicks, which has attracted new users at a fast clip over the past year, says it offers fantasy-sports games, not gambling, and that it only operates in states where its products are legal.
Over the past year, the PrizePicks app has been downloaded more than the sports-gambling apps for Barstool Sports and Caesars Entertainment, and it has been gaining ground on the top two competitors in sports betting, FanDuel and DraftKings, according to estimates by data tracker Apptopia.
The company’s ascent has contributed to growing tension in the fast-evolving U.S. sports-betting industry, where fantasy apps and gambling companies are pursuing sports enthusiasts who are new to betting. Fantasy-sports apps are increasingly making products that are similar to sports betting, but are more lightly regulated.
 Fantasy sports have largely been considered by states to be a game of skill, requiring research and knowledge to be competitive. Sports betting is considered gambling as a game of chance.
Gambling is regulated state-by-state, with different rules governing sports betting and fantasy sports; some states haven’t regulated fantasy sports at all.
Fantasy sports have largely been considered by states to be a game of skill, requiring research and knowledge to be competitive. Sports betting is considered gambling as a game of chance.
Gambling is regulated state-by-state, with different rules governing sports betting and fantasy sports; some states haven’t regulated fantasy sports at all.
 Some gambling regulators and rival companies say that PrizePicks’ model is making sports betting available to a younger audience, as well as in states where it hasn’t been legalized or regulated with consumer protections. In most states, sports betting has a minimum age of 21, while daily fantasy-sports games typically have a minimum age of 18.
Fantasy sports have largely been considered by states to be a game of skill, requiring research and knowledge to be competitive. Sports betting is considered gambling as a game of chance.
Gambling is regulated state-by-state, with different rules governing sports betting and fantasy sports; some states haven’t regulated fantasy sports at all.
Some gambling regulators and rival companies say that PrizePicks’ model is making sports betting available to a younger audience, as well as in states where it hasn’t been legalized or regulated with consumer protections. In most states, sports betting has a minimum age of 21, while daily fantasy-sports games typically have a minimum age of 18.
 The fear is that more areas could become uninsurable. Underwriting requires confidence that models somewhat accurately reflect risks, which climate change is amplifying in scary, unknown ways.
Forecasters are starting to marry both methods, with some startups promising transformative results.
Other startups specialize in disasters that are too unpredictable for many insurance policies, with protection often depending on limited government support. U.K.-based CatRisk Solutions, for example, provides an earthquake-loss model covering 155 countries.
In 2020, New York-based First Street Foundation released an online application where anyone can check their property’s flood exposure. It suggested that federal maps severely underestimate risks.
The rising cost of disasters is more about population increases in hazardous areas than climate change itself. Inigo’s research suggests that demographic shifts have caused more than a doubling in expected annual losses since 1970, compared with a 25% increase from climate change.
The fear is that more areas could become uninsurable. Underwriting requires confidence that models somewhat accurately reflect risks, which climate change is amplifying in scary, unknown ways.
Forecasters are starting to marry both methods, with some startups promising transformative results.
Other startups specialize in disasters that are too unpredictable for many insurance policies, with protection often depending on limited government support. U.K.-based CatRisk Solutions, for example, provides an earthquake-loss model covering 155 countries.
In 2020, New York-based First Street Foundation released an online application where anyone can check their property’s flood exposure. It suggested that federal maps severely underestimate risks.
The rising cost of disasters is more about population increases in hazardous areas than climate change itself. Inigo’s research suggests that demographic shifts have caused more than a doubling in expected annual losses since 1970, compared with a 25% increase from climate change.

 First, European stocks aren’t a very good way to bet on Europe. The market is dominated by multinationals: Successful ones include LVMH, the world’s biggest luxury-goods maker, and Denmark’s Novo Nordisk, maker of the diet drug Wegovy, as well as a bunch of much-less-successful ones, such as Volkswagen, whose shares are at the same level as in the summer of 2007.
Firms in Europe’s Stoxx 600 benchmark make less than half their sales in Europe, according to FactSet data, and the U.S. is their single biggest market, at 23% of revenue. That compares with S&P 500 companies getting 59% of their revenue in the U.S. Britain is even more global, with companies in London’s FTSE 100 making more sales in the U.S. than in the U.K.
European stocks are cheap compared with the U.S., especially U.K. stocks. Even adjusting for the fact the U.S. indexes put more weight on big, expensive technology companies and Europe on cheap banks, Europe is still much cheaper.
Every European sector in the MSCI indexes trades at a lower price-to-earning ratio than those in New York. Compare the U.K., U.S., developed eurozone and Japan, and the U.K. is cheapest in five out of 10 sectors (I excluded real estate, where P/E isn’t an appropriate measure), the eurozone in two, and Japan in three. The U.S. is most expensive in five, Japan in three (communications, thanks to SoftBank, healthcare and consumer staples) and the U.K. in two (technology, ironically enough, where only two big London-listed firms survive, and industrials).
First, European stocks aren’t a very good way to bet on Europe. The market is dominated by multinationals: Successful ones include LVMH, the world’s biggest luxury-goods maker, and Denmark’s Novo Nordisk, maker of the diet drug Wegovy, as well as a bunch of much-less-successful ones, such as Volkswagen, whose shares are at the same level as in the summer of 2007.
Firms in Europe’s Stoxx 600 benchmark make less than half their sales in Europe, according to FactSet data, and the U.S. is their single biggest market, at 23% of revenue. That compares with S&P 500 companies getting 59% of their revenue in the U.S. Britain is even more global, with companies in London’s FTSE 100 making more sales in the U.S. than in the U.K.
European stocks are cheap compared with the U.S., especially U.K. stocks. Even adjusting for the fact the U.S. indexes put more weight on big, expensive technology companies and Europe on cheap banks, Europe is still much cheaper.
Every European sector in the MSCI indexes trades at a lower price-to-earning ratio than those in New York. Compare the U.K., U.S., developed eurozone and Japan, and the U.K. is cheapest in five out of 10 sectors (I excluded real estate, where P/E isn’t an appropriate measure), the eurozone in two, and Japan in three. The U.S. is most expensive in five, Japan in three (communications, thanks to SoftBank, healthcare and consumer staples) and the U.K. in two (technology, ironically enough, where only two big London-listed firms survive, and industrials).
 Focusing on the fact that European stocks don’t rely on the European economy is Mortier’s favorite way to buy the region, buying globally competitive companies that just happen to be European.
The problem is that everyone is doing this: Novo Nordisk, LVMH, the Dutch chip maker ASML and the airplane manufacturer Airbus, among others, are obvious leaders that can’t be ignored by any global investor.
Many Europeans have been giving up on their domestically focused companies, while foreign interest is nonexistent. That has made firms outside the superstar list very cheap. For investors who like to rummage for bargains, Europe, and the U.K. in particular, is the place to look.
In 2022 and 2023 combined, Italy had the best-performing stock market in the Group of Seven leading advanced economies, in dollar terms, followed by France and the U.K., thanks to outperformance by banks. Switzerland, where Credit Suisse imploded, lagged behind. True, the U.S. ended 2021 at an all-time high with many sectors having extremely high valuations, while Europe was cheap. But, umm, look at the market now.
European stocks have been cheap for a while, without attracting buyers. Investors are convinced that Europe’s regulation and social support hurts profit margins. On the plus side, such support makes for some of the world’s best places to live, with four of the top-10 most-livable cities, according to the Economist Intelligence Unit (the U.S. has none).
Focusing on the fact that European stocks don’t rely on the European economy is Mortier’s favorite way to buy the region, buying globally competitive companies that just happen to be European.
The problem is that everyone is doing this: Novo Nordisk, LVMH, the Dutch chip maker ASML and the airplane manufacturer Airbus, among others, are obvious leaders that can’t be ignored by any global investor.
Many Europeans have been giving up on their domestically focused companies, while foreign interest is nonexistent. That has made firms outside the superstar list very cheap. For investors who like to rummage for bargains, Europe, and the U.K. in particular, is the place to look.
In 2022 and 2023 combined, Italy had the best-performing stock market in the Group of Seven leading advanced economies, in dollar terms, followed by France and the U.K., thanks to outperformance by banks. Switzerland, where Credit Suisse imploded, lagged behind. True, the U.S. ended 2021 at an all-time high with many sectors having extremely high valuations, while Europe was cheap. But, umm, look at the market now.
European stocks have been cheap for a while, without attracting buyers. Investors are convinced that Europe’s regulation and social support hurts profit margins. On the plus side, such support makes for some of the world’s best places to live, with four of the top-10 most-livable cities, according to the Economist Intelligence Unit (the U.S. has none).

 Major international oil companies that previously held back on expensive, long-cycle offshore drilling projects have again embraced it after generating prodigious cash flows last year. Investors have become more receptive to such projects after Russia’s invasion of Ukraine highlighted the importance of energy security.
Weakness in North American short-cycle activity notwithstanding, oil-field services firms’ unwavering pipeline of long-cycle contracts signal that the world’s producers, whether major European oil companies or national oil companies, are still in the fossil-fuel business for the long haul.
Major international oil companies that previously held back on expensive, long-cycle offshore drilling projects have again embraced it after generating prodigious cash flows last year. Investors have become more receptive to such projects after Russia’s invasion of Ukraine highlighted the importance of energy security.
Weakness in North American short-cycle activity notwithstanding, oil-field services firms’ unwavering pipeline of long-cycle contracts signal that the world’s producers, whether major European oil companies or national oil companies, are still in the fossil-fuel business for the long haul.
 Controlling the most important currency has helped the U.S. act as the world’s watchdog because threats of exclusion from the dollar-based financial system have had significant weight. If the dollar’s dominance were to erode, that could eventually diminish this authority.
Russian oil has been sold in Chinese yuan, Russian rubles, Emirati dirhams and Indian rupees, according to the Institute of International Finance.
Russia became China’s top crude supplier in 2023, selling over 2 million barrels a day through July, according to S&P Global. Shipments were largely paid for in yuan. Moscow has also shifted major gas contracts to China, according to JPMorgan.
Iran, which mostly sells oil to China in yuan, also has stepped up exports.
Paying in a domestic currency rather than dollars lowers transaction costs, and Russian oil is cheaper than global alternatives. India has emerged as Russia’s biggest new energy customer, Kpler data shows, after New Delhi told its largest oil companies to snap up discounted Russian crude. They have paid in dirhams, yuan and rupees, according to Indian oil executives. Pakistan began paying for Russian oil shipments in the Chinese currency this year, according to JPMorgan. This move coincided with a dollar shortage in the South Asian country.
China eclipsed the U.S. as Saudi Arabia’s biggest trading partner when the U.S. became more energy independent, and it has deepened political ties with Saudi Arabia.
The dollar’s central role in oil markets might again prove difficult to shake. Even if Gulf countries use local currencies for transactions, the dirham and the Saudi riyal themselves are both pegged to the dollar.
Controlling the most important currency has helped the U.S. act as the world’s watchdog because threats of exclusion from the dollar-based financial system have had significant weight. If the dollar’s dominance were to erode, that could eventually diminish this authority.
Russian oil has been sold in Chinese yuan, Russian rubles, Emirati dirhams and Indian rupees, according to the Institute of International Finance.
Russia became China’s top crude supplier in 2023, selling over 2 million barrels a day through July, according to S&P Global. Shipments were largely paid for in yuan. Moscow has also shifted major gas contracts to China, according to JPMorgan.
Iran, which mostly sells oil to China in yuan, also has stepped up exports.
Paying in a domestic currency rather than dollars lowers transaction costs, and Russian oil is cheaper than global alternatives. India has emerged as Russia’s biggest new energy customer, Kpler data shows, after New Delhi told its largest oil companies to snap up discounted Russian crude. They have paid in dirhams, yuan and rupees, according to Indian oil executives. Pakistan began paying for Russian oil shipments in the Chinese currency this year, according to JPMorgan. This move coincided with a dollar shortage in the South Asian country.
China eclipsed the U.S. as Saudi Arabia’s biggest trading partner when the U.S. became more energy independent, and it has deepened political ties with Saudi Arabia.
The dollar’s central role in oil markets might again prove difficult to shake. Even if Gulf countries use local currencies for transactions, the dirham and the Saudi riyal themselves are both pegged to the dollar.
 After falling to a record low in 2020, the average price of a solar photovoltaic system rose in 2021 and then again in 2022, according to data from the Solar Energy Industries Association and Wood Mackenzie. Meanwhile, the average cost to build an onshore wind farm in the U.S. rose in 2020 and 2021 before leveling off last year, according to data from BloombergNEF. Supply-chain issues and interconnection delays already started slowing the clean power industry last year: In 2022 it installed 25.1 Gigawatts of total capacity, a 16% decline from a year earlier, according to the American Clean Power Association, which tracks solar, wind and energy storage. While that’s still enough to meet roughly half of Texas’ electricity demand, it was nonetheless below expectations–though part of the drop was driven by an preplanned phase-down for tax credits commonly used by the wind industry before the Inflation Reduction Act was passed.
 Ultimately, solar and wind’s ability to absorb cost and interest-rate hikes depends on how willing utilities and corporations are to pay higher prices. Many onshore wind and solar projects have been able to renegotiate pricing on their power purchase agreements because demand is robust, according to industry executives. But cracks are showing for offshore wind, which is more exposed to rising costs and rates because it takes longer to develop. BloombergNEF estimates that the weighted average cost of capital for U.S. offshore wind projects rose to 5.25% in 2022 from 4.41% in 2020.
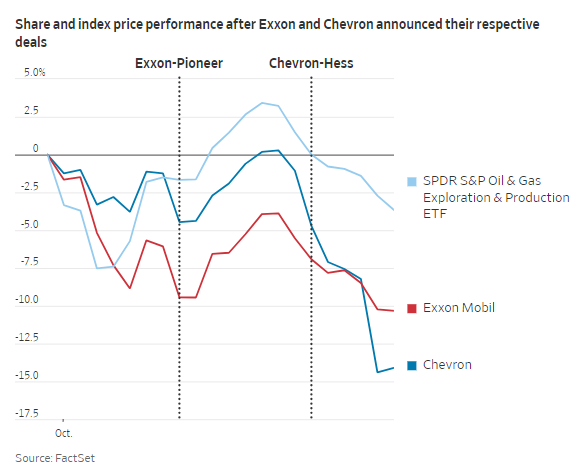 Exxon announced a 4% dividend increase—more generous than last year’s hike of 3%. Both are still generating a lot of free cash flow and returning a good amount of it to shareholders: Exxon and Chevron have paid out $24 billion and $20 billion, respectively, in dividends and buybacks year to date.
Exxon said its energy-products segment was negatively affected by unfavorable timing of its hedges, which will unwind over time. Its chemicals segment, meanwhile, succumbed to compressed industry margins. Chevron reported worse-than-expected international downstream results, which were affected by lower margins on refined-product sales and lower refinery runs because of planned shutdowns.
Investors have expressed doubts about Exxon’s claim that it can produce more out of its and Pioneer’s combined acreage than the companies would have individually, all while reducing costs. In the earnings call on Friday, Exxon gave more color, saying that its method—known as cube development—delivers similar recovery on its own acreage as Pioneer’s, even though Pioneer acreage is higher quality. Cube development allows Exxon to drill multiple horizontal wells in stacked intervals from a single surface location—a method that helps maximize recovery while reducing costs.
Exxon announced a 4% dividend increase—more generous than last year’s hike of 3%. Both are still generating a lot of free cash flow and returning a good amount of it to shareholders: Exxon and Chevron have paid out $24 billion and $20 billion, respectively, in dividends and buybacks year to date.
Exxon said its energy-products segment was negatively affected by unfavorable timing of its hedges, which will unwind over time. Its chemicals segment, meanwhile, succumbed to compressed industry margins. Chevron reported worse-than-expected international downstream results, which were affected by lower margins on refined-product sales and lower refinery runs because of planned shutdowns.
Investors have expressed doubts about Exxon’s claim that it can produce more out of its and Pioneer’s combined acreage than the companies would have individually, all while reducing costs. In the earnings call on Friday, Exxon gave more color, saying that its method—known as cube development—delivers similar recovery on its own acreage as Pioneer’s, even though Pioneer acreage is higher quality. Cube development allows Exxon to drill multiple horizontal wells in stacked intervals from a single surface location—a method that helps maximize recovery while reducing costs.
 Chevron said that the project is expected to cost between 3% and 5% more than the initial plan. Chief Executive Mike Wirth said that the project has had unique issues and that remaining projects in its pipeline are less complex.
 Microsoft was the first to hop on the bandwagon, with Chief Executive Officer Satya Nadella announcing in mid-January a plan to adopt the popular ChatGPT technology from OpenAI across its products.
It is too early for generative AI technology to be driving much if any revenue for all three companies, but it isn’t too early for the costs of those projects to start hitting their bottom lines. And those higher costs will come as the slumping economy compels more large companies to slow down their tech spending. Tim Horan of Oppenheimer trimmed his estimates for Amazon’s AWS and Microsoft’s Azure businesses earlier this month, noting that “enterprises are sweating legacy on-prem infrastructure longer as they take a wait-and-see approach to the economy.”
Microsoft was the first to hop on the bandwagon, with Chief Executive Officer Satya Nadella announcing in mid-January a plan to adopt the popular ChatGPT technology from OpenAI across its products.
It is too early for generative AI technology to be driving much if any revenue for all three companies, but it isn’t too early for the costs of those projects to start hitting their bottom lines. And those higher costs will come as the slumping economy compels more large companies to slow down their tech spending. Tim Horan of Oppenheimer trimmed his estimates for Amazon’s AWS and Microsoft’s Azure businesses earlier this month, noting that “enterprises are sweating legacy on-prem infrastructure longer as they take a wait-and-see approach to the economy.”

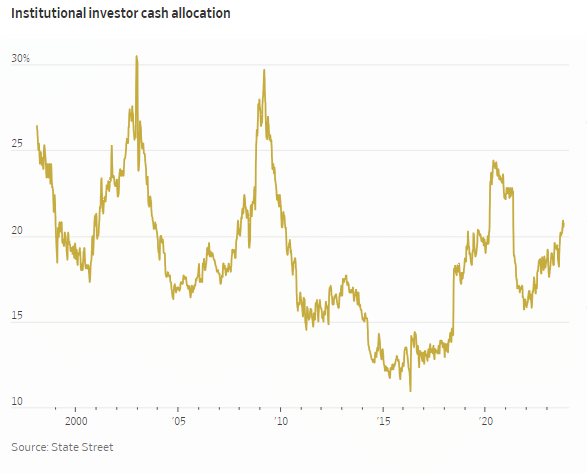 Cash was trash for years on Wall Street, where low interest rates left investors buying every dip, saying there was no alternative to stocks. The prospect of a prolonged period of higher rates has upended that thinking, buffeting both stocks and bonds while increasing the returns offered by some of the safest, shortest-term investments such as money markets.
Yields fluctuate with benchmark rates set by the Federal Reserve.
Though considered to be among the safest of all investments, deposits in the funds aren’t insured and they have occasionally gone haywire in times of stress.
The Fed’s most aggressive interest-rate campaign in decades has lifted rates near the returns many investors would expect from their portfolio on an average year. With the central bank expected to hold rates near this level for some time, money-market funds are now considered a viable investment rather than just a place to stuff cash.
Fees are also relatively high. Investors pay annual expenses based on how much they have invested in a fund. Many large money-market funds charge 0.5% a year in fees, if not more, to support upkeep including administration, trading costs and employee salaries.
Cash was trash for years on Wall Street, where low interest rates left investors buying every dip, saying there was no alternative to stocks. The prospect of a prolonged period of higher rates has upended that thinking, buffeting both stocks and bonds while increasing the returns offered by some of the safest, shortest-term investments such as money markets.
Yields fluctuate with benchmark rates set by the Federal Reserve.
Though considered to be among the safest of all investments, deposits in the funds aren’t insured and they have occasionally gone haywire in times of stress.
The Fed’s most aggressive interest-rate campaign in decades has lifted rates near the returns many investors would expect from their portfolio on an average year. With the central bank expected to hold rates near this level for some time, money-market funds are now considered a viable investment rather than just a place to stuff cash.
Fees are also relatively high. Investors pay annual expenses based on how much they have invested in a fund. Many large money-market funds charge 0.5% a year in fees, if not more, to support upkeep including administration, trading costs and employee salaries.
 Taxes are another consideration, and often a big one. Interest payments on money-market funds are generally taxed as ordinary income, not at dividend or capital-gain rates.
 How the income is taxed at the federal or state level will depend on the investments a fund holds. Interest from U.S. Treasury debt, for example, is taxable at the federal level, but not for states.

 “Active ETFs are garnering more interest given the market volatility we’ve been in, and especially given there are so many leading players that people are familiar with that now offer an ETF version of their strategies,” said Todd Rosenbluth, head of research at VettaFi, a data and analytics firm.
The popularity of active funds this year highlights their durability in the face of years of research showing actively managed stock funds underperforming broad indexes over long time horizons in the U.S.
It also shows how ETFs are helping bring more complex trading strategies to the masses as individual investors buy stocks and ETFs at a record pace. JPMorgan’s Equity Premium Income ETF, which invests in defensive stocks and employs options strategies to generate income, has been the most popular active ETF by far in 2023, taking in $7.1 billion of fresh cash, according to FactSet.
The fund, known by ticker symbol JEPI, provided a 12-month rolling dividend yield of 11.7% during the past year. It launched in 2020 and has exploded in popularity, roughly quadrupling its assets under management from $5.8 billion at the start of 2022 to $24.6 billion today.
Another JPMorgan income-focused options strategy is among this year’s top 10 active ETFs for flows. Four of the other top 10 funds are fixed-income funds, while the remaining four are actively managed equity strategies.
As economic conditions change, some active strategies are falling out of favor. Investors have fled State Street’s SPDR Blackstone Senior Loan ETF, which invests in loans issued by companies that typically have poor credit ratings. The fund’s $1 billion outflow this year is the biggest among active ETFs and represents about one-sixth of its assets at the start of the year.
Cathie Wood’s ARK Innovation fund, perhaps the best known active ETF, has faced roughly $185 million of outflows. Ms. Wood’s fund, which invests mostly in unprofitable but fast-growing technology companies, has rallied 14% this year after a dismal 2022, in which it fell 67%.
“Active ETFs are garnering more interest given the market volatility we’ve been in, and especially given there are so many leading players that people are familiar with that now offer an ETF version of their strategies,” said Todd Rosenbluth, head of research at VettaFi, a data and analytics firm.
The popularity of active funds this year highlights their durability in the face of years of research showing actively managed stock funds underperforming broad indexes over long time horizons in the U.S.
It also shows how ETFs are helping bring more complex trading strategies to the masses as individual investors buy stocks and ETFs at a record pace. JPMorgan’s Equity Premium Income ETF, which invests in defensive stocks and employs options strategies to generate income, has been the most popular active ETF by far in 2023, taking in $7.1 billion of fresh cash, according to FactSet.
The fund, known by ticker symbol JEPI, provided a 12-month rolling dividend yield of 11.7% during the past year. It launched in 2020 and has exploded in popularity, roughly quadrupling its assets under management from $5.8 billion at the start of 2022 to $24.6 billion today.
Another JPMorgan income-focused options strategy is among this year’s top 10 active ETFs for flows. Four of the other top 10 funds are fixed-income funds, while the remaining four are actively managed equity strategies.
As economic conditions change, some active strategies are falling out of favor. Investors have fled State Street’s SPDR Blackstone Senior Loan ETF, which invests in loans issued by companies that typically have poor credit ratings. The fund’s $1 billion outflow this year is the biggest among active ETFs and represents about one-sixth of its assets at the start of the year.
Cathie Wood’s ARK Innovation fund, perhaps the best known active ETF, has faced roughly $185 million of outflows. Ms. Wood’s fund, which invests mostly in unprofitable but fast-growing technology companies, has rallied 14% this year after a dismal 2022, in which it fell 67%.